Case Studies
This is only a small selection of the countless applications of ground penetrating radar
23
JUL
2022
Comparison of Georadar Measurements and Geological Sections
It is a special stroke of luck when, after a ground radar measurement, an excavator digs a dig across the measured lines.
In this archaeological project, the data were not easily interpretable due to the complex surface geology. Only the dig revealed what was really to be seen on the radar data.

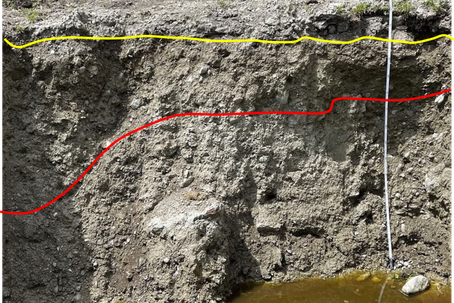
On the left picture you can see the georadar measurement, on the right picture the outcrop. Different soil layers correspond to reflectors on the georadar. The uppermost layer of humus is interpreted in yellow, red is an internal layer of soil.
22
JUL
2022
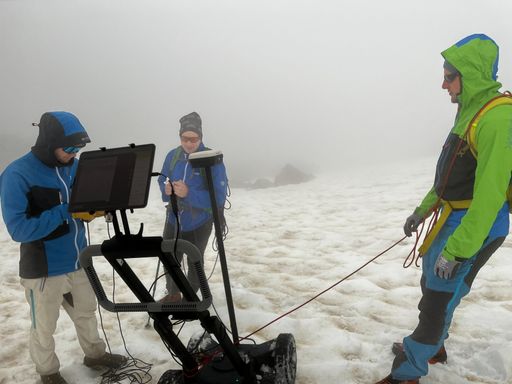
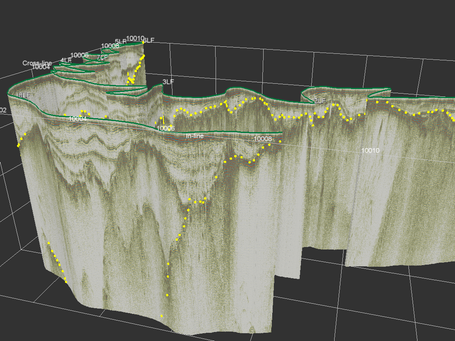
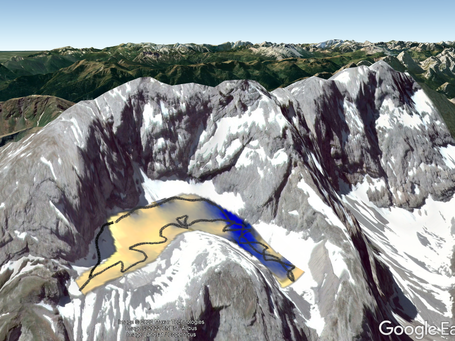
Measuring Snow Thickness on the Eiskar Glacier
At the end of May I had the opportunity to take my georadar with me to the annual measurement of the snow thickness on the Eiskar glacier with the Eiskar "veterans" Gerhard Hohenwarter Senior and Junior. Although the GS8000 was not specifically built for use in the rough terrain of high alpine mountains, the data was impressive and showed not only the remaining snow thickness from last winter, but also the internal structure of Austria's southernmost glacier. The first results can be seen in the pictures, more detailed interpretations are waiting to be made.


01 FEB
2022
Proceq Case Study Video
I am very pleased that Proceq found my work so exciting that they created this video for me and to market their products.
23 JAN 2022
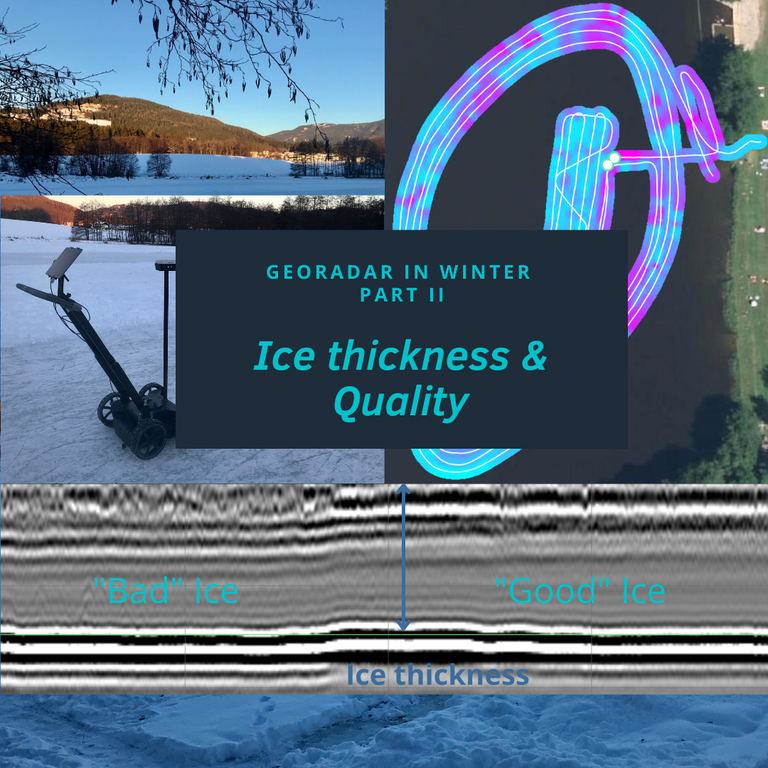
Georadar on Ice
In winter there is not only snow, but many lakes are already frozen over. Of course this attracts many to the ice! But, how many times have you asked yourself, "How thick is the ice I'm walking on?"
This is an ideal area of application for georadar. The measurement on the ice provides highly accurate information about the thickness and even the quality of the ice in just a few minutes. And that in 3D! Of course I checked the thickness measurements at one point with the drill and the results were accurate to 1cm..
14
JAN
2022
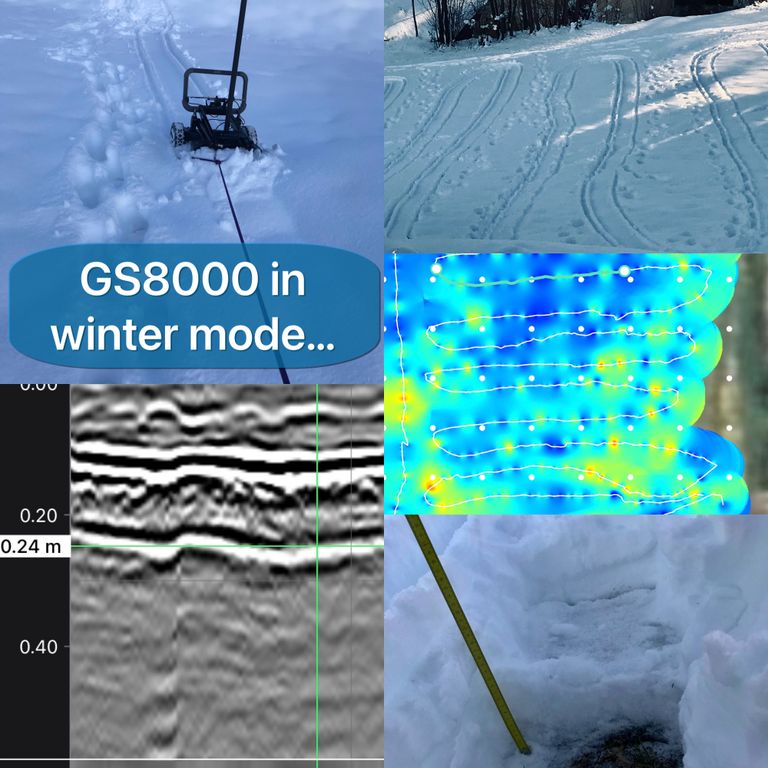
Snow Thickness Measurements
After winter is finally here in the south of Austria, it was the right time to test my radar in snowy conditions.. After a bit of preparation it worked quite nicely!
The good thing is, you can see the track in the field 😀
First I was skeptical on the results. But after some digging it was confirmed that the two snow events this winter could be seen on the radargram. Snow thickness was correctly measured with an error of 1cm.. the iced surface of the first snow in December gave a strong reflection.
5
OCT
2021
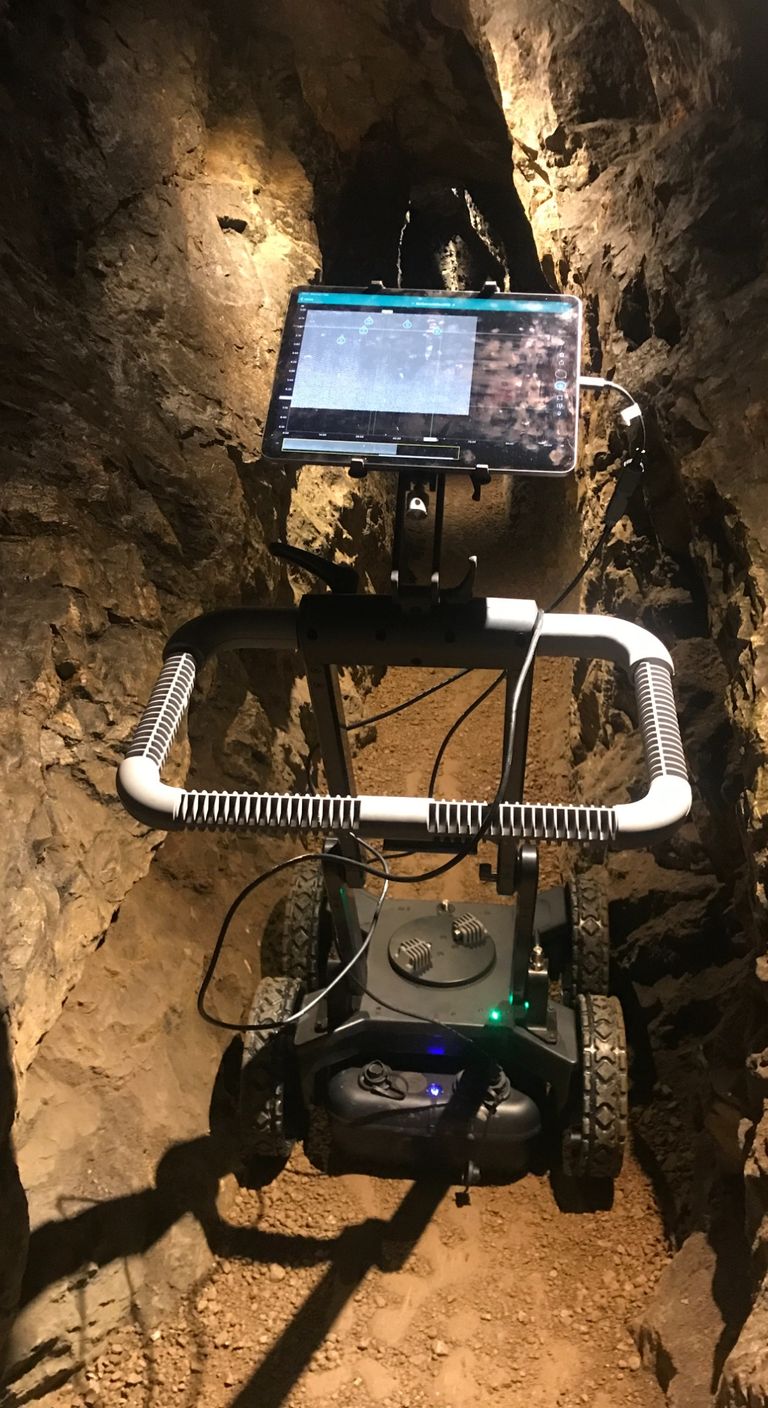
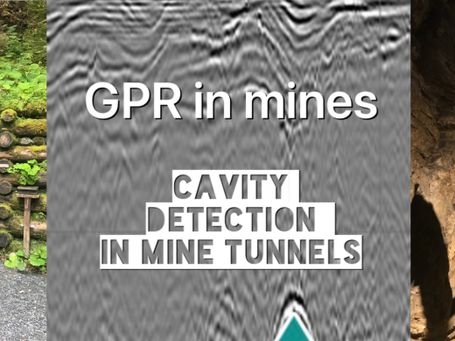
Show-mine Leogang
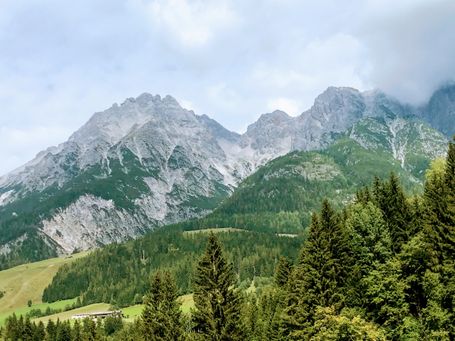
The show mine Leogang is located in the Schwarzleo valley and was once part of a major mining area in the Austrian Alps. Due to its great diversity in minerals the area was already known in the bronze age. From 1400 on, mining was operated over 500 years in four different mining areas (Nöckelberh, Inschlagalpe, Vogelhalte and Schwarzleo).
The oldest part of the mining area is Schwarzleo. Between 1400 and 1833 ores containing silver, copper, mercury, nickel, cobalt, and lead were mined. Several tunnels were dug into the rock, creating an underground network of about 20 kilometres. Today, the Barbara tunnel and the Daniel tunnel are accessible as show mine today. The size of further tunnels as the Erasmusstollen or Johannisstolllen, can only be estimated from historical maps, as parts of the tunnels and galleries are collapsed. Further, some gallery entrances are buried and therefore, a large part of the mining area is not accessible anymore.
Mining buildings in the Schwarzleo valley are also not preserved and are mainly known from historical maps only. Vegetation, maintenance of roads and agricultural activities additionally hamper the localization of historical buildings and mines.
The “Knappschaft Leogang” is interested in the preservation and investigation of the cultural heritage. Therefore, cavity exploration was carried out using a ground-penetrating radar to localise foundations of historical buildings, tunnel entrances and cavities. As non-invasive geophysical method, the ground-penetrating radar works without leaving traces in the nature.
The GPR or ground-penetrating radar method uses high-frequency electromagnetic waves, which are emitted into the subsurface and reflected at boundary layers or cavities. Depending on the geological conditions, this enables to build a high-resolution image of the shallow subsoil in two-dimensional sections or as a three-dimensional model. Since electromagnetic waves are strongly absorbed, the penetration depth is limited to a maximum of 5-10 m.
Various questions were successfully answered in the area of the Leogang show mine. Among other things, the foundations of former mine buildings and broken tunnel entrances were located. Measurements were also carried out in the mine gallery, which indicate possible cavities under the existing tunnels.

10
AUG
2021
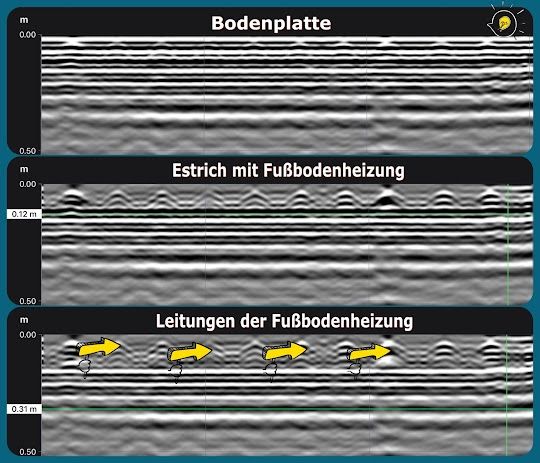
GPR indoor
With GPR measurements it was possible to locate thickness of concrete, screet, reinforcements and underfloor heating in great detail
27
JUL
2021
Utility Detection Part II
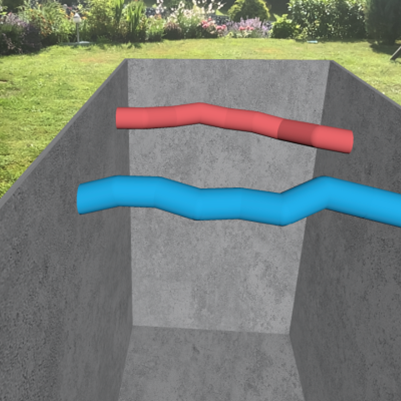
Again looking for a line! This time found: gas, water and sewer under the asphalt surface.
Would be interesting to compare that with the official plans ... surprises not excluded!

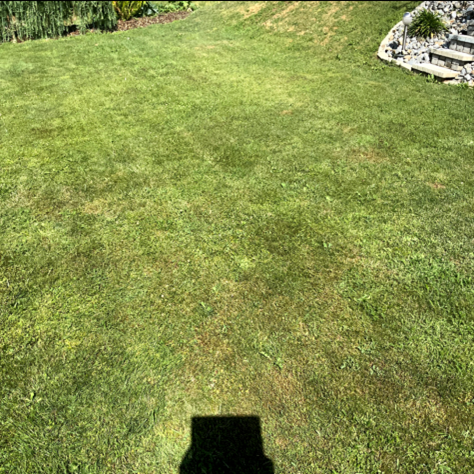
There I stand looking at my English lawn not knowing where the water lines are
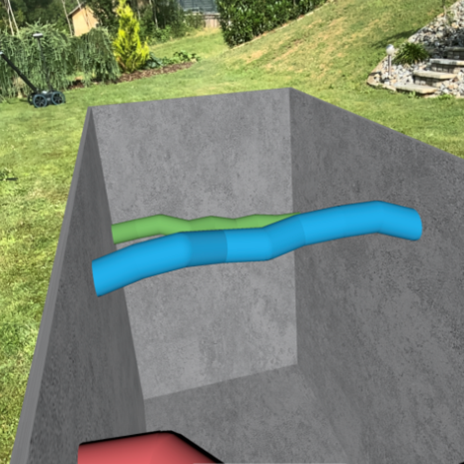
After some time I knew where they where, and I even could show them in AR. Apart from the expected green water pipe and red electricity cable I found even another unknown pipe...
14
JUL
2021
Water pipe detection on private property
For a long time I was wondering where pipes go under the lawn of my garden. I knew that at the time of construction the excavators laid out the pipe somewhere in the area shown on the left... but where I could not say.
This changed after two hours of GPR measurements and interpretation. Now I know exactly where my pipes are in case I have to do excavation again (for whatever reason) or the water pipe is broken.
Apart from that it is really cool to see the pipes under my garden in augmented reality!
I guess I have to dig to see what the blue thing is... might be another power line
18
JUL
2021
Asphalt Quality/Thickness
Base Gravel Fill
A few days ago I took out my GPR to see what's going on beneath my driveway. The quality of the resulting data was quite good especially in the shallow section. So I decided to acquire a dense grid of GPR data and to test a few seismic interpretation methods on the data.
So after importing the data I applied some basic processing to highlight things I wanted to interpret.
Then with the dense grid of a pseudo 3D measurement I could interpret the two features I was interested in.
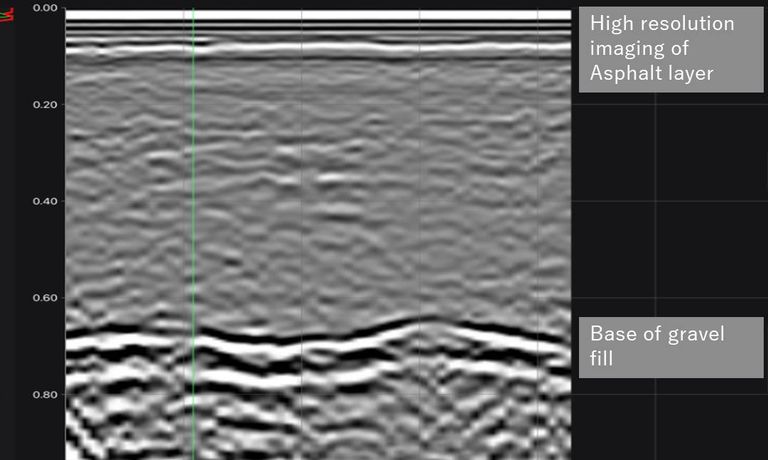
First data showed good resolution in the very first centimeters of asphalt and a prominent boundary which can only be the base of the gravel fill used as road foundation

Data imported into seismic interpretation system and applied some basic processing
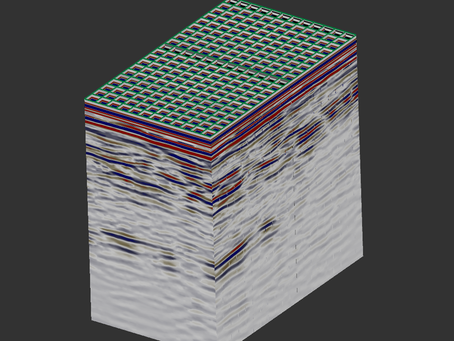
Dense pseudo 3D data
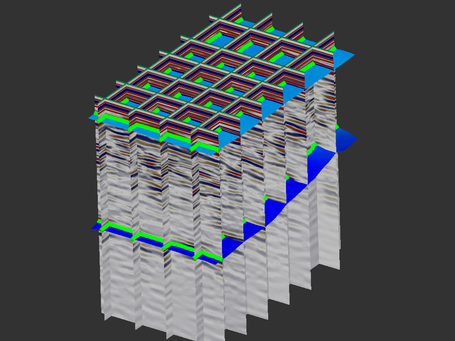
Two horizons picked on GPR data
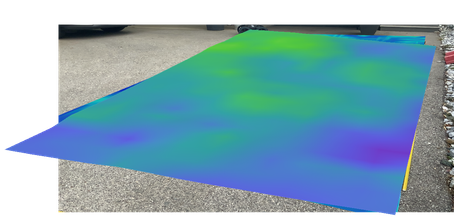
Displaying the asphalt thickness map in augmented reality shows where the asphalt quality is better (green is thicker asphalt, blue is thinner).
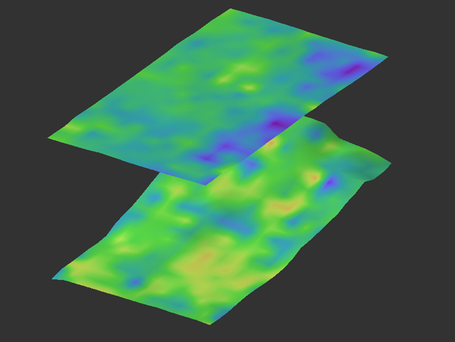
Extracted amplitudes on interpreted base asphalt and base gravel